Page 159 - 警政統計月報108年8月版(資料期108年7月)
P. 159

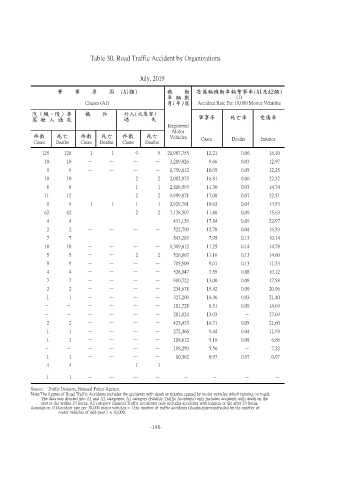
Table 30. Road Traffic Accident by Organizations


                                                   July, 2019

                       肇    事    原    因  (A1類)              機    動      每萬輛機動車輛肇事率(A1及A2類)
                                                            車 輛 數                   (1)
                               Causes (A1)                  月(年)底     Accident Rate Per 10,000 Mortor Vehicles
              汽(機、慢)車          機    件        行人(或乘客)
            駕 駛 人 過 失                        過        失                肇事率        死亡率       受傷率
                                                            Registered
                                                              Motor
             件數      死亡      件數     死亡      件數      死亡       Vehicles   Cases     Deaths     Injuries
             Cases   Deaths  Cases  Deaths  Cases   Deaths
                125     126      1      1        9      9   21,987,755    12.21       0.06     16.10
                 10     10      -      -        -      -     3,219,826    9.66        0.03     12.97
                 9       9      -      -        -      -     1,759,612    10.05       0.05     12.25
                 10     10      -      -         2      2    2,002,973    16.81       0.06     22.32
                 8       8      -      -         1      1    2,818,593    11.30       0.03     14.74
                 11     12      -      -         2      2    1,999,871    17.08       0.07     22.51
                 9       9       1      1        1      1    2,929,761    10.62       0.04     14.53
                 62     62      -      -         2      2    7,138,507    11.88       0.09     15.63
                 4       4      -      -        -      -      431,139     17.84       0.09     22.97
                 2       2      -      -        -      -      522,790     12.78       0.04     16.33
                 7       7      -      -        -      -      543,283     7.95        0.13     10.14
                 18     18      -      -        -      -     1,319,612    11.25       0.14     14.78
                 5       5      -      -         2      2     526,067     11.16       0.13     14.60
                 9       9      -      -        -      -      705,509     9.01        0.13     11.53
                 4       4      -      -        -      -      528,947     7.55        0.08     10.12
                 7       7      -      -        -      -      910,722     13.00       0.08     17.58
                 2       2      -      -        -      -      234,678     15.42       0.09     20.96
                 1       1      -      -        -      -      327,209     16.36       0.03     21.40
                -       -       -      -        -      -      111,728     8.51        0.09     14.69
                -       -       -      -        -      -      281,024     13.03        -       17.69
                 2       2      -      -        -      -      423,433     16.71       0.05     21.60
                 1       1      -      -        -      -      272,366     9.44        0.04     11.93
                 1       1      -      -        -      -      118,612     5.16        0.08      6.68
                -       -       -      -        -      -      108,250     5.56         -        7.22
                 1       1      -      -        -      -       10,362     0.97        0.97      0.97
                 4       4      -      -         1      1         -         -          -         -
                 1       1      -      -        -      -          -         -          -         -

            Source:  Traffic Division, National Police Agency.
            Note:The figures of Road Traffic Accidents includes the accidents with death or injuries caused by motor vehicles which running on roads.
                 The data was divided into A1 and A2 categories. A1 category (Fatality Traffic Accidents) only includes accidents with death on the
                 spot or die within 24 horus. A2 category (Injured Traffic accidents) only includes accidents with injuries or die after 24 horus.
              Annotation: (1)Accident rate per 10,000 motor vehicles =(the number of traffic accidents (deaths,injuries)divided by the number of
                          motor vehicles of mid-year)× 10,000.

                                                      -148-
   154   155   156   157   158   159   160   161   162   163   164