Page 159 - 警政統計月報108年7月版(資料期108年6月)
P. 159

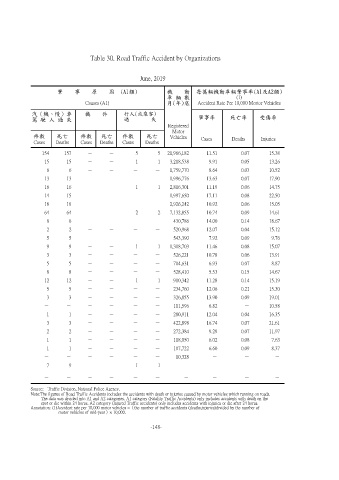
Table 30. Road Traffic Accident by Organizations


                                                   June, 2019

                       肇    事    原    因  (A1類)              機    動      每萬輛機動車輛肇事率(A1及A2類)
                                                            車 輛 數                   (1)
                               Causes (A1)                  月(年)底     Accident Rate Per 10,000 Mortor Vehicles
              汽(機、慢)車          機    件        行人(或乘客)
            駕 駛 人 過 失                        過        失                肇事率        死亡率       受傷率
                                                            Registered
                                                              Motor
             件數      死亡      件數     死亡      件數      死亡       Vehicles   Cases     Deaths     Injuries
             Cases   Deaths  Cases  Deaths  Cases   Deaths
                154     157     -      -         5      5   21,966,182    11.51       0.07     15.38
                 15     15      -      -         1      1    3,218,538    9.91        0.05     13.26
                 6       6      -      -        -      -     1,759,770    8.64        0.03     10.52
                 13     13      -      -        -      -     1,996,776    13.63       0.07     17.90
                 16     16      -      -         1      1    2,816,301    11.19       0.06     14.75
                 14     15      -      -        -      -     1,997,650    17.11       0.08     22.50
                 18     18      -      -        -      -     2,926,242    10.92       0.06     15.05
                 64     64      -      -         2      2    7,132,855    10.74       0.09     14.61
                 6       6      -      -        -      -      430,786     14.00       0.14     18.67
                 2       2      -      -        -      -      520,968     12.07       0.04     15.12
                 5       5      -      -        -      -      543,390     7.92        0.09      9.76
                 9       9      -      -         1      1    1,318,703    11.46       0.08     15.07
                 3       3      -      -        -      -      526,221     10.78       0.06     13.91
                 5       5      -      -        -      -      704,631     6.93        0.07      8.87
                 8       8      -      -        -      -      528,410     5.53        0.15     14.67
                 12     12      -      -         1      1     910,342     11.28       0.14     15.19
                 5       5      -      -        -      -      234,760     12.06       0.21     15.30
                 3       3      -      -        -      -      326,855     13.90       0.09     19.01
                -       -       -      -        -      -      111,596     6.82         -       10.58
                 1       1      -      -        -      -      280,911     12.04       0.04     16.35
                 3       3      -      -        -      -      422,898     16.74       0.07     21.61
                 2       2      -      -        -      -      272,384     9.29        0.07     11.97
                 1       1      -      -        -      -      118,050     6.02        0.08      7.63
                 1       1      -      -        -      -      107,722     6.60        0.09      8.37
                -       -       -      -        -      -       10,328       -          -         -
                 7       9      -      -         1      1         -         -          -         -
                -       -       -      -        -      -          -         -          -         -

            Source:  Traffic Division, National Police Agency.
            Note:The figures of Road Traffic Accidents includes the accidents with death or injuries caused by motor vehicles which running on roads.
                 The data was divided into A1 and A2 categories. A1 category (Fatality Traffic Accidents) only includes accidents with death on the
                 spot or die within 24 horus. A2 category (Injured Traffic accidents) only includes accidents with injuries or die after 24 horus.
              Annotation: (1)Accident rate per 10,000 motor vehicles =(the number of traffic accidents (deaths,injuries)divided by the number of
                          motor vehicles of mid-year)× 10,000.

                                                      -148-
   154   155   156   157   158   159   160   161   162   163   164