
Page 19 - 警政統計月報108年8月版(資料期108年7月)
P. 19
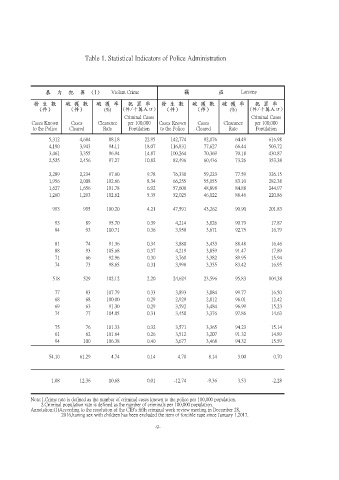
Table 1. Statistical Indicators of Police Administration


                 暴  力  犯  罪  (1)        Violent Crime             竊          盜        Larceny
             發 生 數      破 獲 數      破 獲 率      犯 罪 率       發 生 數     破 獲 數      破 獲 率      犯 罪 率
               (件)        (件)         (%)   (件/十萬人口)        (件)       (件)         (%)    (件/十萬人口)
                                             Criminal Cases                              Criminal Cases
            Cases Known   Cases    Clearance  per 100,000  Cases Known  Cases   Clearance  per 100,000
             to the Police  Cleared  Rate     Population  to the Police  Cleared  Rate     Population
                  5,312      4,684     88.18        22.95    142,774     92,076     64.49      616.98
                  4,190      3,943     94.11        18.07    116,831     77,627     66.44      503.72
                  3,461      3,355     96.94        14.87    100,264     70,369     70.18      430.87
                  2,525      2,456     97.27        10.82     82,496     60,436     73.26      353.38

                  2,289      2,234     97.60         9.78     76,330     59,223     77.59      326.15
                  1,956      2,008    102.66         8.34     66,255     55,055     83.10      282.38
                  1,627      1,656    101.78         6.92     57,606     48,898     84.88      244.97
                  1,260      1,293    102.62         5.35     52,025     46,022     88.46      220.86

                   993        995     100.20         4.21     47,591     43,262     90.90      201.83

                    93         89      95.70         0.39      4,214     3,826      90.79       17.87
                    84         93     110.71         0.36      3,958     3,671      92.75       16.79

                    81         74      91.36         0.34      3,880     3,433      88.48       16.46
                    88         93     105.68         0.37      4,219     3,859      91.47       17.89
                    71         66      92.96         0.30      3,760     3,382      89.95       15.94
                    74         73      98.65         0.31      3,998     3,335      83.42       16.95

                   518        529     102.12         2.20     24,624     23,596     95.83      104.38

                    77         83     107.79         0.33      3,893     3,884      99.77       16.50
                    68         68     100.00         0.29      2,929     2,812      96.01       12.42
                    69         63      91.30         0.29      3,592     3,484      96.99       15.23
                    74         77     104.05         0.31      3,450     3,376      97.86       14.63

                    75         76     101.33         0.32      3,571     3,365      94.23       15.14
                    61         62     101.64         0.26      3,512     3,207      91.32       14.89
                    94        100     106.38         0.40      3,677     3,468      94.32       15.59


                  54.10      61.29      4.74         0.14      4.70       8.14      3.00         0.70


                   1.08      12.36     10.68         0.01     -12.74      -9.36     3.53        -2.28


            Note:1.Crime rate is defined as the number of criminal cases known to the police per 100,000 population.
                2.Criminal population rate is defined as the number of criminals per 100,000 population.
            Annotation:(1)According to the resolution of the CIB's fifth criminal work review meeting in December 28,
                                   2016,having sex with children has been excluded the item of forcible rape since January 1,2017.

                                                         -9-