
Page 119 - 警政統計月報108年8月版(資料期108年7月)
P. 119
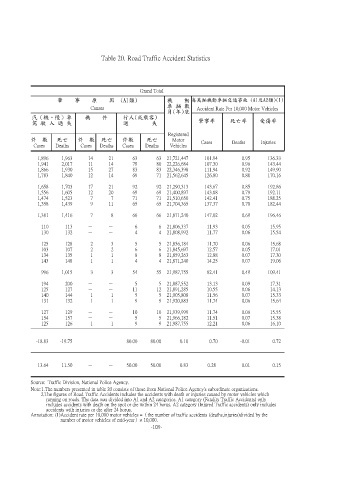
Table 20. Road Traffic Accident Statistics


                                                  Grand Total
                       肇    事    原    因  (A1類)              機    動  每萬輛機動車輛交通事故 (A1及A2類)(1)
                                 Causes                     車 輛 數     Accident Rate Per 10,000 Motor Vehicles
                                                            月(年)底
              汽(機、慢)車          機    件       行人(或乘客)
            駕 駛 人 過 失                       過        失                 肇事率        死亡率       受傷率

                                                            Registered
            件  數     死亡     件  數    死亡      件數      死亡        Motor     Cases     Deaths     Injuries
             Cases   Deaths  Cases  Deaths  Cases   Deaths   Vehicles

              1,896    1,963    14     21       63      63  21,721,447   101.94       0.95     136.33
              1,941    2,017    11     14       79      80  22,226,684   107.30       0.96     143.44
              1,866    1,930    15     27       83      83  22,346,398   111.94       0.92     149.90
              1,783    1,840    12     14       69      71  21,562,645   126.80       0.88     170.16
              1,658    1,703    17     21       92      92  21,290,313   143.67       0.85     192.86
              1,556    1,605    12     20       69      69  21,400,897   143.08       0.79     192.11
              1,474    1,523     7      7       71      71  21,510,650   142.41       0.75     188.25
              1,358    1,439     9     11       65      65  21,704,365   137.37       0.70     182.44

              1,381    1,416     7      8       66      66  21,871,240   147.02       0.69     196.46
                110     113     -      -        6        6  21,806,337    11.93       0.05      15.95
                130     132     -      -        4        4  21,808,992    11.77       0.06      15.54

                125     128      2      3       5        5  21,836,184    11.70       0.06      15.68
                103     107      2      2       6        6  21,845,697    12.57       0.05      17.01
                134     135      1      1       8        8  21,859,263    12.88       0.07      17.30
                143     148      1      1       4        4  21,871,240    14.25       0.07      19.06
                996    1,015     3      3       54      55  21,987,755    82.41       0.49     109.41

                194     200     -      -        5        5  21,887,552    13.13       0.09      17.31
                125     127     -      -        11      12  21,891,285    10.55       0.06      14.13
                140     144      1      1       5        5  21,905,808    11.56       0.07      15.33
                131     132      1      1       9        9  21,920,883    11.74       0.06      15.64

                127     129     -      -        10      10  21,939,999    11.74       0.06      15.55
                154     157     -      -        5        5  21,966,182    11.51       0.07      15.38
                125     126      1      1       9        9  21,987,755    12.21       0.06      16.10


              -18.83  -19.75    -      -     80.00    80.00     0.10       0.70      -0.01       0.72


              13.64    11.50    -      -     50.00    50.00     0.83      0.28        0.01       0.15

            Source:  Traffic Division, National Police Agency.
            Note:1.The numbers presented in table 20 consists of those from National Police Agency's subordinate organizations.
                2.The figures of Road Traffic Accidents includes the accidents with death or injuries caused by motor vehicles which
                    running on roads. The data was divided into A1 and A2 categories. A1 category (Fatality Traffic Accidents) only
                    includes accidents with death on the spot or die within 24 horus. A2 category (Injured Traffic accidents) only includes
                    accidents with injuries or die after 24 horus.
              Annotation: (1)Accident rate per 10,000 motor vehicles =(the number of traffic accidents (deaths,injuries)divided by the
                         number of motor vehicles of mid-year)× 10,000.
                                                      -109-