Page 177 - 警政統計月報108年8月版(資料期108年7月)
P. 177

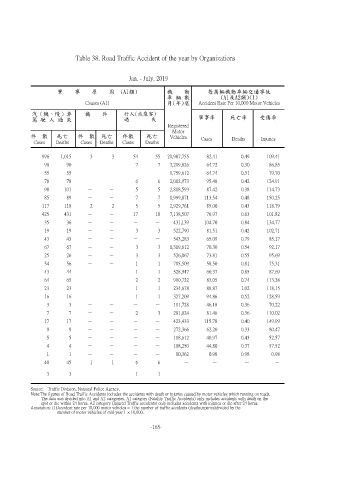
Table 38. Road Traffic Accident of the year by Organizations


                                               Jan. - July, 2019

                       肇    事    原    因  (A1類)              機    動        每萬輛機動車輛交通事故
                                                            車 輛 數               (A1及A2類)(1)
                               Causes (A1)                  月(年)底      Accident Rate Per 10,000 Motor Vehicles
              汽(機、慢)車          機    件        行人(或乘客)
            駕 駛 人 過 失                        過        失                肇事率        死亡率       受傷率
                                                            Registered
                                                              Motor
            件  數     死亡     件  數    死亡      件數      死亡       Vehicles   Cases     Deaths     Injuries
             Cases   Deaths  Cases  Deaths  Cases   Deaths

                996   1,015      3      3       54      55  21,987,755    82.41       0.49     109.41
                 90     90      -      -         7      7    3,219,826    64.72       0.30     86.85
                 55     55      -      -        -      -     1,759,612    64.74       0.31     79.70
                 78     78      -      -         6      6    2,002,973    95.48       0.42     124.91
                 98     101     -      -         5      5    2,818,593    87.42       0.38     114.73
                 85     89      -      -         7      7    1,999,871   113.54       0.48     150.25
                117     118      2      2        5      5    2,929,761    85.00       0.43     118.79
                425     431     -      -        17      18   7,138,507    76.97       0.63     101.82
                 35     36      -      -        -      -      431,139    104.70       0.84     134.77
                 19     19      -      -         3      3     522,790     81.51       0.42     102.71
                 43     43      -      -        -      -      543,283     65.09       0.79     85.17
                 67     67      -      -         3      3    1,319,612    70.30       0.54     92.17
                 25     26      -      -         3      3     526,067     73.81       0.55     95.69
                 54     56      -      -         1      1     705,509     58.50       0.81     75.31
                 43     44      -      -         1      1     528,947     60.37       0.85     87.69
                 64     65      -      -         2      2     910,722     83.05       0.74     113.38
                 23     23      -      -         1      1     234,678     88.87       1.02     118.15
                 16     16      -      -         1      1     327,209     94.86       0.52     128.59
                 3       3      -      -        -      -      111,728     46.18       0.36     70.22
                 7       7      -      -         2      3     281,024     81.46       0.36     110.02
                 17     17      -      -        -      -      423,433    115.78       0.40     149.99
                 9       9      -      -        -      -      272,366     62.20       0.33     80.47
                 5       5      -      -        -      -      118,612     40.97       0.43     52.57
                 4       4      -      -        -      -      108,250     44.80       0.37     57.52
                 1       1      -      -        -      -       10,362     0.98        0.98      0.98
                 40     45       1      1        6      6         -         -          -         -

                 3       3      -      -         1      1         -         -          -         -

            Source:  Traffic Division, National Police Agency.
            Note:The figures of Road Traffic Accidents includes the accidents with death or injuries caused by motor vehicles which running on roads.
                 The data was divided into A1 and A2 categories. A1 category (Fatality Traffic Accidents) only includes accidents with death on the
                 spot or die within 24 horus. A2 category (Injured Traffic accidents) only includes accidents with injuries or die after 24 horus.
              Annotation: (1)Accident rate per 10,000 motor vehicles =(the number of traffic accidents (deaths,injuries)divided by the
                         number of motor vehicles of mid-year)× 10,000.

                                                      -165-
   172   173   174   175   176   177   178   179   180   181   182