
Page 177 - 警政統計月報108年7月版(資料期108年6月)
P. 177
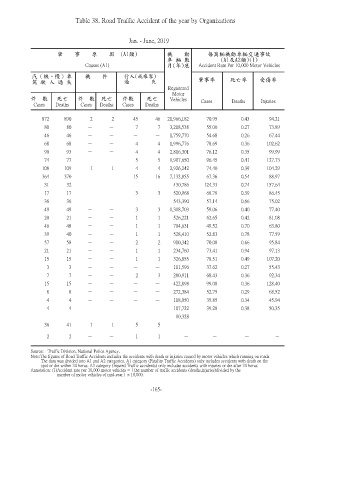
Table 38. Road Traffic Accident of the year by Organizations


                                               Jan. - June, 2019

                       肇    事    原    因  (A1類)              機    動        每萬輛機動車輛交通事故
                                                            車 輛 數               (A1及A2類)(1)
                               Causes (A1)                  月(年)底      Accident Rate Per 10,000 Motor Vehicles
              汽(機、慢)車          機    件        行人(或乘客)
            駕 駛 人 過 失                        過        失                肇事率        死亡率       受傷率
                                                            Registered
                                                              Motor
            件  數     死亡     件  數    死亡      件數      死亡       Vehicles   Cases     Deaths     Injuries
             Cases   Deaths  Cases  Deaths  Cases   Deaths


                872     890      2      2       45      46  21,966,182    70.95       0.43     94.21
                 80     80      -      -         7      7    3,218,538    55.06       0.27     73.89
                 46     46      -      -        -      -     1,759,770    54.68       0.26     67.44
                 68     68      -      -         4      4    1,996,776    78.69       0.36     102.62
                 90     93      -      -         4      4    2,816,301    76.12       0.35     99.99
                 74     77      -      -         5      5    1,997,650    96.45       0.41     127.73
                108     109      1      1        4      4    2,926,242    74.40       0.39     104.29
                364     370     -      -        15      16   7,132,855    67.36       0.54     88.97
                 31     32      -      -        -      -      430,786    124.33       0.74     157.64
                 17     17      -      -         3      3     520,968     68.79       0.39     86.45
                 36     36      -      -        -      -      543,390     57.14       0.66     75.02
                 49     49      -      -         3      3    1,318,703    59.06       0.40     77.40
                 20     21      -      -         1      1     526,221     62.65       0.42     81.08
                 46     48      -      -         1      1     704,631     49.52       0.70     63.80
                 39     40      -      -         1      1     528,410     52.83       0.78     77.59
                 57     58      -      -         2      2     910,342     70.08       0.66     95.84
                 21     21      -      -         1      1     234,760     73.41       0.94     97.13
                 15     15      -      -         1      1     326,855     78.51       0.49     107.20
                 3       3      -      -        -      -      111,596     37.62       0.27     55.43
                 7       7      -      -         2      3     280,911     68.43       0.36     92.34
                 15     15      -      -        -      -      422,898     99.08       0.36     128.40
                 8       8      -      -        -      -      272,384     52.75       0.29     68.52
                 4       4      -      -        -      -      118,050     35.85       0.34     45.94
                 4       4      -      -        -      -      107,722     39.28       0.38     50.35
                -       -       -      -        -      -       10,328       -          -         -
                 36     41       1      1        5      5         -         -          -         -
                 2       2      -      -         1      1         -         -          -         -

            Source:  Traffic Division, National Police Agency.
            Note:The figures of Road Traffic Accidents includes the accidents with death or injuries caused by motor vehicles which running on roads.
                 The data was divided into A1 and A2 categories. A1 category (Fatality Traffic Accidents) only includes accidents with death on the
                 spot or die within 24 horus. A2 category (Injured Traffic accidents) only includes accidents with injuries or die after 24 horus.
              Annotation: (1)Accident rate per 10,000 motor vehicles =(the number of traffic accidents (deaths,injuries)divided by the
                         number of motor vehicles of mid-year)× 10,000.

                                                      -165-