
Page 169 - 警政統計月報108年8月版(資料期108年7月)
P. 169
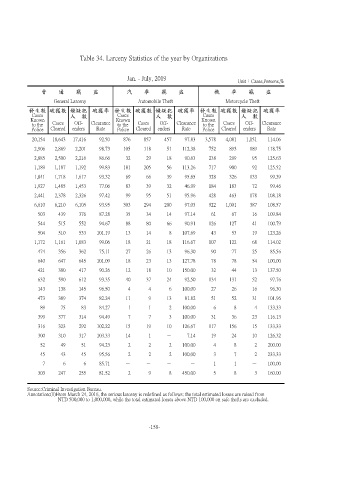
Table 34. Larceny Statistics of the year by Organizations


                                              Jan. - July, 2019
                                                                                      Unit:Cases,Persons,%
                  普  通  竊  盜                    汽  車  竊  盜                    機  車  竊  盜
                    General Larceny               Automobile Theft              Motorcycle Theft
           發生數 破獲數 嫌疑犯 破獲率 發生數 破獲數 嫌疑犯 破獲率 發生數 破獲數 嫌疑犯 破獲率
            Cases         人  數            Cases         人  數            Cases         人  數
            Known                         Known                         Known
            to the  Cases  Off-  Clearance  to the  Cases  Off-  Clearance  to the  Cases  Off-  Clearance
            Police  Cleared  enders  Rate  Police  Cleared  enders  Rate  Police  Cleared  enders  Rate
            20,154  18,643  17,416  92.50   876     857    457    97.83  3,578  4,081  1,151   114.06
             2,906  2,869  2,201    98.73   105     118     51   112.38   752     893    189   118.75
             2,885  2,500  2,216    86.66    32     29      18    90.63   238     299     95   125.63
             1,189  1,187  1,192    99.83   181     205     56   113.26   717     900     92   125.52
             1,841  1,718  1,617    93.32    69     66      39    95.65   328     326    133    99.39
             1,927  1,485  1,453    77.06    83     39      32    46.99   184     183     72    99.46
             2,441  2,378  2,326    97.42    99     95      51    95.96   428     463    178   108.18
             6,610  6,210  6,105    93.95   303     294    200    97.03   922   1,001    387   108.57
              503     439    376    87.28    35     34      14    97.14    61     67      16   109.84
              544     515    552    94.67    88     80      66    90.91   126     127     41   100.79

              504     510    533   101.19    13     14      8    107.69    43     53      19   123.26
             1,172  1,161  1,083    99.06    18     21      18   116.67   107     122     68   114.02
              474     356    362    75.11    27     26      13    96.30    90     77      25    85.56
              640     647    645   101.09    18     23      13   127.78    78     78      54   100.00
              421     380    417    90.26    12     18      10   150.00    32     44      13   137.50
              632     590    612    93.35    40     37      24    92.50   134     131     52    97.76
              143     138    145    96.50     4      4      6    100.00    27     26      16    96.30
              473     389    374    82.24    11      9      13    81.82    51     52      31   101.96
               89     75      83    84.27     1      1      2    100.00     6      8      4    133.33
              399     377    314    94.49     7      7      3    100.00    31     36      23   116.13
              316     323    292   102.22    15     19      10   126.67   117     156     15   133.33
              300     310    317   103.33    14      1     -       7.14    19     24      10   126.32
               52     49      51    94.23     2      2      2    100.00     4      8      2    200.00
               45     43      45    95.56     2      2      2    100.00     3      7      2    233.33
                7      6      6     85.71    -      -      -        -       1      1     -     100.00
              303     247    255    81.52     2      9      8    450.00     5      8      3    160.00


           Source:Criminal Investigation Bureau.
           Annotation:(1)From March 24, 2016, the serious larceny is redefined as follows: the total estimated losses are raised from
                                  NTD 500,000 to 1,000,000, while the total estimated losses above NTD 100,000 on safe thefts are excluded.


                                                      -158-