
Page 169 - 警政統計月報108年7月版(資料期108年6月)
P. 169
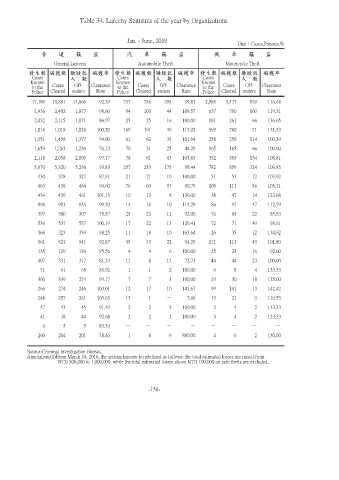
Table 34. Larceny Statistics of the year by Organizations


                                              Jan. - June, 2019
                                                                                      Unit:Cases,Persons,%
                  普  通  竊  盜                    汽  車  竊  盜                    機  車  竊  盜

                    General Larceny               Automobile Theft              Motorcycle Theft
           發生數 破獲數 嫌疑犯 破獲率 發生數 破獲數 嫌疑犯 破獲率 發生數 破獲數 嫌疑犯 破獲率
            Cases         人  數            Cases         人  數            Cases         人  數
            Known                         Known                         Known
            to the  Cases  Off-  Clearance  to the  Cases  Off-  Clearance  to the  Cases  Off-  Clearance
            Police  Cleared  enders  Rate  Police  Cleared  enders  Rate  Police  Cleared  enders  Rate
            17,189  15,881  14,866  92.39   757     756    395    99.87  2,985  3,477    939   116.48
             2,436  2,402  1,877    98.60    94     103     44   109.57   637     760    160   119.31
             2,432  2,115  1,871    86.97    25     25      16   100.00   191     261     66   136.65
             1,016  1,018  1,026   100.20   169     191     49   113.02   593     780     71   131.53
             1,551  1,458  1,377    94.00    61     62      35   101.64   258     259    114   100.39
             1,659  1,263  1,230    76.13    70     31      25    44.29   165     165     66   100.00
             2,118  2,058  2,009    97.17    78     81      43   103.85   352     383    134   108.81
             5,670  5,320  5,230    93.83   257     253    175    98.44   782     859    324   109.85
              430     378    327    87.91    21     21      10   100.00    51     53      12   103.92
              463     438    464    94.60    76     69      57    90.79   105     111     36   105.71
              434     439    461   101.15    10     13      8    130.00    38     47      14   123.68
              996     993    935    99.70    14     16      10   114.29    86     97      47   112.79
              397     300    307    75.57    25     23      11    92.00    76     65      22    85.53
              536     537    537   100.19    17     22      13   129.41    72     71      49    98.61
              366     323    359    88.25    11     18      10   163.64    26     35      12   134.62

              561     521    541    92.87    35     33      22    94.29   111     113     49   101.80
              135     129    136    95.56     4      4      6    100.00    25     23      16    92.00
              407     331    317    81.33    11      8      13    72.73    44     44      23   100.00
               71     61      65    85.92     1      1      2    100.00     6      8      4    133.33
              360     339    274    94.17     7      7      3    100.00    24     30      18   125.00
              266     274    246   103.01    12     17      10   141.67    99     141     13   142.42
              248     257    261   103.63    13      1     -       7.69    19     21      9    110.53
               47     43      45    91.49     2      2      2    100.00     3      4      2    133.33
               41     38      40    92.68     2      2      2    100.00     3      4      2    133.33
                6      5      5     83.33    -      -      -        -      -      -      -        -
              260     204    201    78.46     1      8      6    800.00     4      6      2    150.00


           Source:Criminal Investigation Bureau.
           Annotation:(1)From March 24, 2016, the serious larceny is redefined as follows: the total estimated losses are raised from
                                  NTD 500,000 to 1,000,000, while the total estimated losses above NTD 100,000 on safe thefts are excluded.


                                                      -158-