
Page 120 - 警政統計月報108年7月版(資料期108年6月)
P. 120
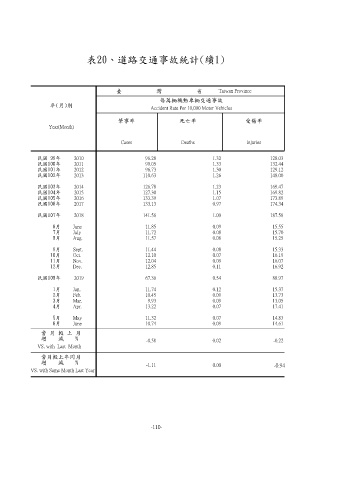
表20、道路交通事故統計(續1)


                                          臺            灣            省         Taiwan Province
                                                         每萬輛機動車輛交通事故
                   年(月)別
                                                      Accident Rate Per 10,000 Motor Vehicles

                                          肇事率                   死亡率                    受傷率
                  Year(Month)


                                           Cases                 Deaths                 Injuries

              民國 99年       2010                     96.28                   1.32                128.03
              民國100年       2011                     99.05                   1.33                132.44
              民國101年       2012                     96.73                   1.30                129.12
              民國102年       2013                    110.63                   1.26                148.00
              民國103年       2014                    126.78                   1.23                169.47
              民國104年       2015                    127.30                   1.15                169.82
              民國105年       2016                    133.39                   1.07                173.89
              民國106年       2017                    133.13                   0.97                174.34

              民國107年       2018                    141.56                   1.00                187.58
                    6月     June                     11.85                   0.09                 15.55
                    7月     July                     11.72                   0.08                 15.70
                    8月     Aug.                     11.57                   0.08                 15.25
                    9月     Sept.                    11.44                   0.08                 15.33
                   10月     Oct.                     12.10                   0.07                 16.19
                   11月     Nov.                     12.04                   0.09                 16.07
                   12月     Dec.                     12.85                   0.11                 16.92
              民國108年       2019                     67.36                   0.54                 88.97

                    1月     Jan.                     11.74                   0.12                 15.37
                    2月     Feb.                     10.45                   0.09                 13.73
                    3月     Mar.                      9.93                   0.09                 13.05
                    4月     Apr.                     13.22                   0.07                 17.41
                    5月     May                      11.32                   0.07                 14.83
                    6月     June                     10.74                   0.09                 14.61
               當 月 較 上 月
               增    減    %                          -0.58                   0.02                 -0.22
              VS. with  Last  Month
               當月較上年同月
               增    減    %
                                                    -1.11                   0.00                 -0.94
            VS. with Same Month Last Year


                                                      -110-